
Understanding Your Emotions
We want to stress the importance of separating fact from fiction – as an investor, as well as in your everyday life. This article discusses emotional reactions to unfolding news, and the impact that can have on your financial well-being.
The Usual Emotions in Unusual Times
COVID-19 has seized almost every headline around. If anything, current events have made this article even more important. Thoughtful, sober answers to our most pressing questions must now compete against a deluge of emotional misinformation that can be as virulent as the ailment itself. There’s nothing wrong with having emotions – even strong ones. Emotions are not only unavoidable, they’re essential. But remember:
When you put your feelings in the financial driver’s seat, they will steer you toward what your instincts would prefer, rather than what reason might dictate.
Behavioral Finance and Emotional Investing
There is an extensive field of study dedicated to understanding how our instincts and emotions often interfere with our ability to make rational financial decisions. This study is called behavioral finance. Suffice it to say here, every investor faces strong, hardwired temptations to: chase illusory trends, fear the very investment risks that are expected to generate our greatest rewards, regret even our most sensible decisions in the face of minor setbacks, disregard the most durable data and overreact to breaking news and emotion-triggering language.
Strong feelings, while natural, WILL create cognitive blind spots in your reasoning. Add the speed and omnipresence of the Internet, and it becomes even easier to lead with your emotions.
Powering Past Your Emotions
So, as an evidence-based investor, how do you navigate past these and many other emotional traps? It can help to have an objective advisor point out your own behavioral blind spots. But you can help yourself as well.
Has something you’ve seen, heard, or read left you “stirred up”? Again, we’re not suggesting you should repress every feeling. But the more aggressively an appeal tugs at your emotions – in fear, anger, excitement, or elation – the more important it is to avoid being consumed by it. Especially if it involves your financial well-being, we strongly recommend hitting the pause button before making any next move. Take your emotional “temperature.” Wait for the heat to subside. Most importantly, take some time to conduct extra due diligence before taking the bait. We are here to help you power past those emotional challenging times.
When it’s Value vs. Growth, History is on Value’s Side
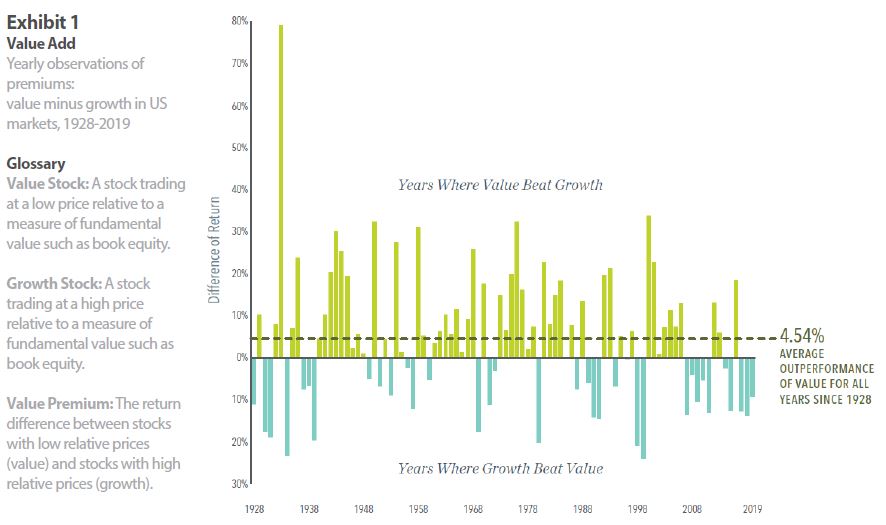
Logic and data provide the basis for a positive expected value premium, offering a guide for investors targeting higher potential returns. There is pervasive historical evidence of value stocks outperforming growth stocks. Data covering nearly a century in the US, and nearly five decades of market data outside the US, support the notion that value stocks—those with lower relative prices— have higher expected returns.
Recently, growth stocks have enjoyed a run of outperformance vs. their value counterparts. But while disappointing periods emerge from time to time, the principle that lower relative prices lead to higher expected returns remains the same. On average, value stocks have outperformed growth stocks by 4.54% annually in the US since 1928, as Exhibit 1 shows.
Some historical context is helpful in providing perspective for growth stocks’ recent outperformance. As Exhibit 1 demonstrates, realized premiums are highly volatile. While periods of underperformance are disappointing, they are also within the range of possible outcomes.
We believe investors are best served by making decisions based on sound economic principles supported by a preponderance of evidence. Value investing is based on the premise that paying less for a set of future cash flows is associated with a higher expected return. That’s one of the most fundamental tenets of investing. Combined with the long series of empirical data on the value premium, our research shows that value investing continues to be a reliable way for investors to increase expected returns going forward.
source information:
Past performance is no guarantee of future results. Investing risks include loss of principal and fluctuating value. There is no guarantee an investment strategy will be successful. Indices are not available for direct investment. Their performance does not reflect the expenses associated with the management of an actual portfolio.
In US dollars. Yearly premiums are calculated as the difference in one-year returns between the two indices described. Value minus growth: Fama/French US Value Research Index minus the Fama/French US Growth Research Index.
Fama/French US Value Research Index: Provided by Fama/French from CRSP securities data. Includes the lower 30% in price-to-book of NYSE securities (plus NYSE Amex equivalents since July 1962 and Nasdaq equivalents since 1973).
Fama/French US Growth Research Index: Provided by Fama/French from CRSP securities data. Includes the higher 30% in price-to-book of NYSE securities (plus NYSE Amex equivalents since July 1962 and Nasdaq equivalents since 1973).
https://www.mydimensional.com/when-its-value-versus-growth-history-is-on-values-side
Eugene Fama and Ken French are members of the Board of Directors of the general partner of, and provide consulting services to, Dimensional Fund Advisors LP.
The information in this document is provided in good faith without any warranty and is intended for the recipient’s background information only. It does not constitute investment advice, recommendation, or an offer of any services or products for sale and is not intended to provide a sufficient basis on which to make an investment decision. It is the responsibility of any persons wishing to make a purchase to inform themselves of and observe all applicable laws and regulations. Unauthorized copying, reproducing, duplicating, or transmitting of this document are strictly prohibited. Dimensional accepts no responsibility for loss arising from the use of the information contained herein.
“Dimensional” refers to the Dimensional separate but affiliated entities generally, rather than to one particular entity. These entities are Dimensional Fund Advisors LP, Dimensional Fund Advisors Ltd., Dimensional Ireland Limited, DFA Australia Limited, Dimensional Fund Advisors Canada ULC, Dimensional Fund Advisors Pte. Ltd., Dimensional Japan Ltd., and Dimensional Hong Kong Limited. Dimensional Hong Kong Limited is licensed by the Securities and Futures Commission to conduct Type 1 (dealing in securities) regulated activities only and does not provide asset management services. UNITED STATES: Dimensional Fund Advisors LP is an investment advisor registered with the Securities and Exchange Commission.
Irony in the Stock Market

In an accompanying article in this issue, we have included information on “understanding your emotions”. We wanted to expound on this concept and how we react to market fluctuations. When markets are hitting all-time highs, investors have a positive attitude and have a tendency to want to invest in the stock market. However, when stock markets plunge, as they did earlier this year when the coronavirus hit, investors often think that they want to get out of the market. This reaction to the market being “on sale” is ironical. You would think that people would flock to invest in the market during these times.
Just think of people’s reactions to January “white sales”, end of model year clearance sales on vehicles, and the buying frenzy on “Black Friday”. People will camp out and stand in line for hours on “Black Friday” to get a “deal”. It is said that the stock market is the only market that when prices are low or “on sale”, instead of customers flocking to the market they tend to run from it.
We are here to help you through the periods of market fluctuations and help you stay on track with your eyes focused on your long-term financial goals.
Bulls, Bears, and Long-Term Benefits of Stock Investing
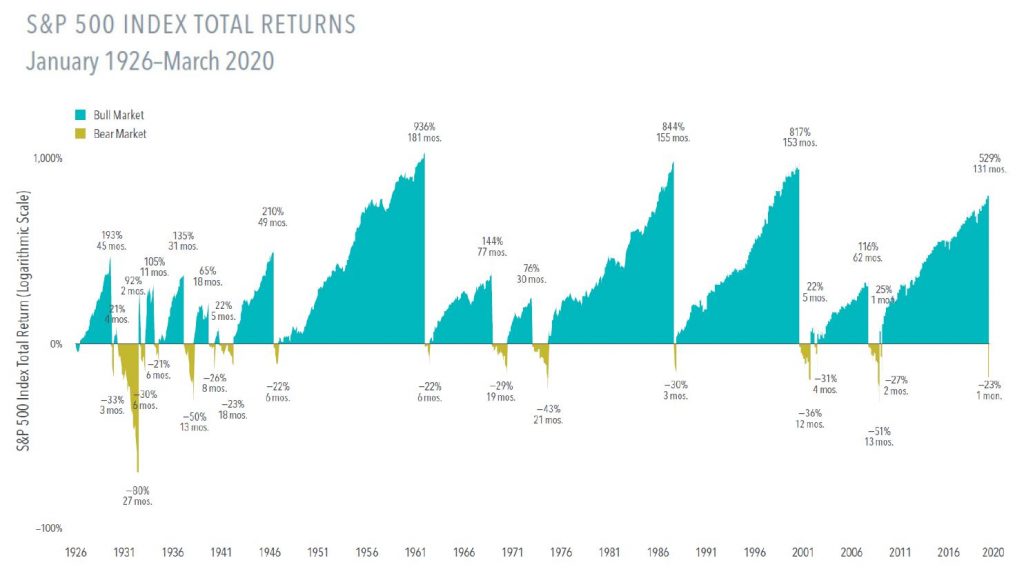
Stock returns are volatile, but nearly a century of bull and bear markets shows that the good times have outshined the bad times.
From 1926 through March 31, 2020, the S&P 500 Index experienced 17 bear markets, or a fall of at least 20% from a previous peak. The declines ranged from -21% to -80% across an average length of around 10 months.
On the upside, there were 17 bull markets, or gains of at least 20% from a previous trough. They averaged 56 months in length, and advances ranged from 21% to 936%.
When the bull and bear markets are viewed together, it’s clear equities have rewarded disciplined investors.
The stock market’s ups and downs are unpredictable, but history supports an expectation of positive returns over the long term. For the best shot at the benefits the market can offer, stay the course.
source information:
Past performance is no guarantee of future results. Indices are not available for direct investment; therefore, their performance does not reflect the expenses associated with the management of an actual portfolio. In USD. Chart end date is 3/31/2020, the last peak to trough return of −23% represents the return through March 2020. Due to availability of data, monthly returns are used January 1926 through December 1989; daily returns are used January 1990 through present. Periods in which cumulative return from peak is −20% or lower and a recovery of 20% from trough has not yet occurred are considered Bear markets. Bull markets are subsequent rises following the bear market trough through the next recovery of at least 20%. The chart shows bear markets and bull markets, the number of months they lasted and the associated cumulative performance for each market period. Results for different time periods could differ from the results shown. A logarithmic scale is a nonlinear scale in which the numbers shown are a set distance along the axis and the increments are a power, or logarithm, of a base number. This allows data over a wide range of values to be displayed in a condensed way.
Source: S&P data © 2020 S&P Dow Jones Indices LLC, a division of S&P Global. All rights reserved.
Dimensional Fund Advisors LP is an investment advisor registered with the Securities and Exchange Commission.
2020. What a Year it Has Been So Far
This has definitely been one of the stranger years that any of us has experienced. Coronavirus, stock market plunges, civil unrest and protests, and an unusual election year are just a few of things that have plagued the year. We are still trying to fight coronavirus by wearing masks and social distancing. Hopefully, immunization will become a reality by the end of this year to help curb or stop this virus. The stock market has recovered to some extent but is still not back completely. The election will continue to be interesting this year with it being one of the more bitterly partisan elections in recent memory. I’m sure we will be ready for all the political advertising to end by Election Day in November.
Back in the first newsletter of the year, we dealt with planning for your vacation. Whatever planning that you may have done for your vacation was assuredly modified or canceled. The latest news for football enthusiasts is that most of the college football games are either canceled or postponed to 2021. Until a year like 2020 happens, we do not realize how dependent we are on certain events to mark time during the year, thus losing your concept of time when they do not happen.
Through all of this, one thing that has remained constant is the need to communicate. The means by which we have communicated with each other may have changed in some cases, but we have been able to communicate. While originally, it was not ideal to transition to almost exclusively using virtual communication, it has created an opportunity to learn and utilize the technology we have at our fingertips. We ask you to please contact us if you have any questions or concerns. Stay safe and healthy and have a wonderful fall!